graph result in abaqus
hi Abaqus students.
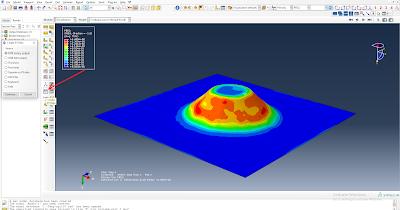
We will see about getting graph results in Abaqus software in this post. Once the simulation we have created is complete, click on the resulting menu. After clicking on the resulting menu, the visualization page opens. Click on the x, y create data icon, which is the eleventh icon from the top to the bottom of the side menu icons of this visualization page. This icon is written in red as x, y with some grid. Clicking on this icon will create a new mini tab called create x, y data. It will have the ODB history output menu tick. Click on continue without making any changes to it. Once clicked, the graph format menu for various results will appear in a new tab.
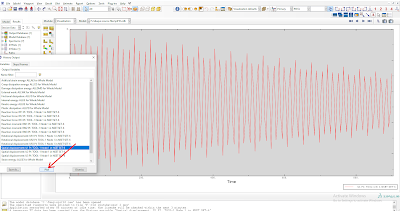
Select the graph result we want and click on the plot option to get our graph view. The resulting graph result can be saved as an image file in png format or any other format by clicking on the print icon.Also, if you click on the animated time history icon in the side menu icons, you can get the changes in the graph result with the animation point.


Comments
Post a Comment
Thanks for visiting my blog