abaqus results save
hi Abaqus students.
We will see how to save the results in Abaqus software in this post. When the project we have worked on is submitted and completed, we get the results button. Click the results button. Clicking on the results button will take you to the visualization page.
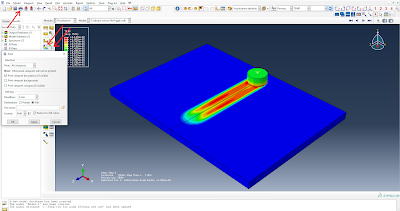
This visualization page will have a plot undeformed shape icon select by default in the sidebar icon. In this case, the object we created will be green. We need to move the cursor button and select the plot contours on the deformed shape icon under the plot undeformed shape icon. The icon comes in a variety of colors including red, yellow, green, and purple and it's like L is slightly curved. In this case, the object we created will appear as a multi-colored object from the green.
On this page, we select the print icon just below the top menu bar (file, model, viewport, view, etc). This icon is located just below the model button in the top menu.
Clicking on this print icon will create a new tap. Follow the steps below on that tab. In the box next to the selected print, select All viewports. Below are the three tick box icons. Tick the print viewport decorations box first. Just tick the print viewport decorations box so we get the results in transparent background. And if the three boxes are ticked, we will get the result as in our visualization page. Next in the settings rendition box should be in color. The destination must be in file state.
Create a result saving folder before proceeding to the next step. Next, click on the yellow icon next to the file name box, select the folder we created and give the result a name. In the next format box, select png format or tiff format. Also, tick the box next to it. Then click on the ok button at the bottom of the tab and the result is saved in the folder we created.
Also, if you click on the common options at the top of the sidebar icons at the top (next to the module visualization) and select basic> free edge, the mesh on the object will be removed. This icon is yellow in the range 123. Next, click on the contours options icon next to the plot contours on the deformed shape icon to create a new tab. In this, we can apply banded, quilt, isosurface, etc., and get a special layout of many contours we need. Also increasing the discrete level of contours intervals will increase the colors used in the contour. This results in more data display. Next, click on the limits button in this tab and click on the show location tick box button and the result is maximum and minimum value display.
The next step is to click on viewport> viewport annotation options in the top menu and a new tab will be created. In this tab, you can change the display by unticking the unnecessary ones in the various tick boxes in general. Also in this tab, you can go to legend and change the format from scientific to fixed and change the result value digits by reducing the size of the decimal place from one to three.

Comments
Post a Comment
Thanks for visiting my blog